Steel Rebar Price Trends (2000–2025)
Steel rebar (reinforcing bar) is a critical component in the construction industry, used for reinforcing concrete structures. Between 2000 and 2025, global steel rebar price have undergone significant shifts due to economic cycles, geopolitical tensions, raw material availability, and production capacities of key players. Understanding these price movements and the countries behind the largest outputs of steel helps stakeholders in construction, manufacturing, and trading make better investment and procurement decisions.
Historical Overview of Steel Rebar Prices (2000–2025)
Steel rebar prices remained relatively stable during the early 2000s, typically averaging between $200–$350 per metric ton. Around 2004–2007, with rapid industrialization in China and rising demand globally, prices surged, peaking at over $1,200/MT in some markets just before the 2008 financial crisis.
The global economic crisis triggered a sharp drop in demand, which pushed prices down to nearly $400/MT by 2009. However, between 2010 and 2015, the market gradually recovered. During this period, prices fluctuated between $500 and $700/MT as regional demand varied across different markets.
Post-2016, steel rebar prices saw gradual increases driven by infrastructure projects, especially in developing nations. The COVID-19 pandemic in 2020 disrupted supply chains and construction projects, causing volatility. However, a steep rebound occurred in 2021–2022, with rebar prices hitting $900–$1,000/MT amid strong post-pandemic recovery and tight supply.
In early 2025, prices have softened slightly, with rebar futures trading around CNY 3,280 per tonne (~$450/MT), reflecting a cooling demand from major construction markets like China and some production cutbacks to balance supply.
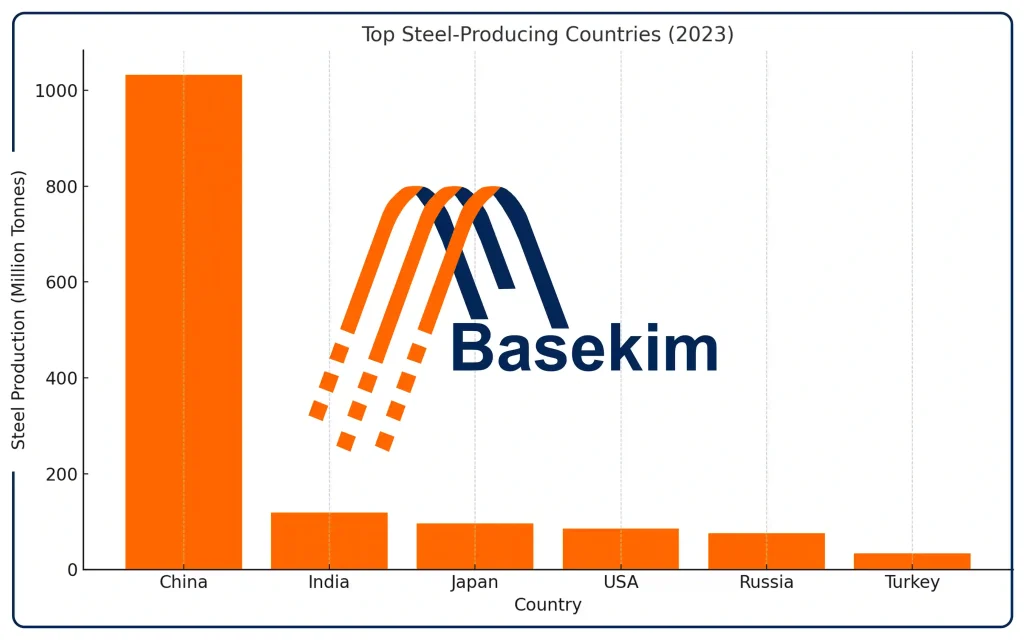
Top Steel-Producing Countries
Steel production is concentrated in a handful of industrial powerhouses. The top steel-producing countries as of 2023 are:
1. China
Production: 1,032.8 million tonnes
Overview: China dominates the steel industry with over 50% of global output. It heavily influences global rebar prices, and policy changes such as carbon neutrality targets and capacity controls directly affect market dynamics.
2. India
Production: 118.2 million tonnes
Overview: India has consistently increased steel capacity, driven by domestic construction and infrastructure demands like highways, smart cities, and rural development.
3. Japan
Production: 96.3 million tonnes
Overview: Japan’s steel industry, though mature, is technologically advanced and focused on high-grade steels. Domestic consumption remains stable with limited export dependency.
4. United States
Production: 85.8 million tonnes
Overview: The U.S. market is driven by infrastructure bills and sustainable manufacturing. Recent tariffs and reshoring policies have impacted pricing and imports.
5. Russia
Production: 76.0 million tonnes
Overview: Sanctions and geopolitical issues have limited Russia’s ability to export steel, influencing global rebar supply chains and opening opportunities for other exporters.
6. Turkey
Production: 33.7 million tonnes
Overview: Turkey is one of the world’s largest exporters of rebar, with key markets in the Middle East, Africa, and Europe. The country has a competitive edge due to its strategic location and modern production facilities. Despite economic headwinds and inflation, Turkey continues to play a pivotal role in global rebar trade.
Standard Steel Rebar Sizes
Rebar is available in various sizes depending on the country and building codes:
United States: Numbered by 1/8 inch increments (e.g., #4 = 1/2 inch diameter).
Europe: Metric sizes like 8mm, 10mm, 12mm, 16mm, up to 50mm.
Turkey: Commonly produces 8mm to 32mm for export markets.
Japan & India: Mostly metric, with heavy use in infrastructure.
Russia: Produces GOST-standard rebar for industrial projects.
Key Factors Influencing Rebar Prices
Steel rebar prices don’t exist in a vacuum. Several global factors impact these values:
Raw Material Costs: Iron ore and scrap steel are primary inputs. A surge in iron ore costs directly lifts steel prices.
Energy Prices: Steel manufacturing is energy-intensive. Gas and electricity price hikes increase production costs.
Shipping and Logistics: Global freight rates and port congestions can add premiums to landed rebar prices.
Regulations and Tariffs: Import/export restrictions, duties, and anti-dumping regulations influence cross-border trade and supply.
Geopolitical Stability: Conflicts, sanctions, and political instability can disrupt supply chains and pricing.
Turkey’s Role in the Global Rebar Market
Turkey’s steel industry is primarily export-focused, with competitive rebar pricing due to its cost-effective production and short shipping distances to major regions. In recent years, Turkish rebar exports have filled gaps left by reduced Russian supply and tightening Chinese exports. Turkish mills often adjust production in response to global market needs and demand shifts.
Recent Developments and Market Outlook (2025)
In 2025, steel rebar prices are stabilizing after pandemic-era volatility. China is cutting excess production to align with environmental goals. India and Turkey are expanding their market reach. Emerging economies in Africa and Southeast Asia are increasing demand for rebar due to urban development and infrastructure growth.
In short
Steel rebar price trends from 2000 to 2025 clearly illustrate the global economic journey, moving through periods of growth, crisis, recovery, and eventually transitioning toward sustainability. By examining the roles of leading producers—China, India, Japan, the USA, Russia, and Turkey—we gain valuable insights into the direction of the market. As the construction sector continues to advance, steel rebar plays a crucial role, directly linking to industrial policies, ongoing innovation, and the shifting landscape of global trade.